Marital Status and Household Type
Viewing marriage through an economic lens, marital status is an important tool for economic well-being since it allows individuals to combine their financial resources as well as receive certain tax benefits. Also, women who marry and stay married accumulate more wealth (everything you own subtracted from everything you owe) compared to women that do not marry or experience marital instability [1].
Key Points
On average, from 2014-2018, Black females had a significantly lower marriage rate than White females and Latina females.
Black and Latina females had higher rates of never marrying than White females, and Latina females have the lowest rate of being divorced, separated, or widowed.
Among all females, there was a slight decrease in marriage rates and a slight increase in females having never been married from 2006-2018.
Compared to Latinx and White residents, a lower proportion of Black residents lived in married-couple households, and a higher percentage of Black residents lived in households headed by unmarried females.
In 2018, households headed by married couples were the most common type of household with about 55% of residents reporting living in married-couple households.
This is followed by households headed by unmarried females, with about 21% of residents reporting living in these households.
Historical Context
Marriage has undergone a great transformation in America since the mid-1900s when marriage rates were at their highest [2]. The age at which people are first-married (i.e., their first marriage) has gotten older, especially for women. Further, the alternatives to marriage such as cohabitation, having children outside of marriage, and living apart from an intimate partner have become more socially acceptable and feasible than at any other point in history [3].
Despite these changes, marriage remains highly desirable for most Americans although differences in who gets married have emerged over time [3][4]. The racial gap in marriage, which is the most pronounced for Black Americans compared to White Americans, began in the mid-1960s and the gap is at its widest today [4]. There are several contributing factors to this gap and many are rooted in systems of inequality [5]. Higher incarceration and mortality rates in conjunction with the economic disadvantages Black Americans face in this country have eroded marriage opportunities for many over time. Education attainment is also linked to marriage with the least educated Americans having the lowest marital rates, but the racial inequalities persist within education groups.
Data Dashboards
Marital Status
1-year Estimates
5-year Estimates
Key Points:
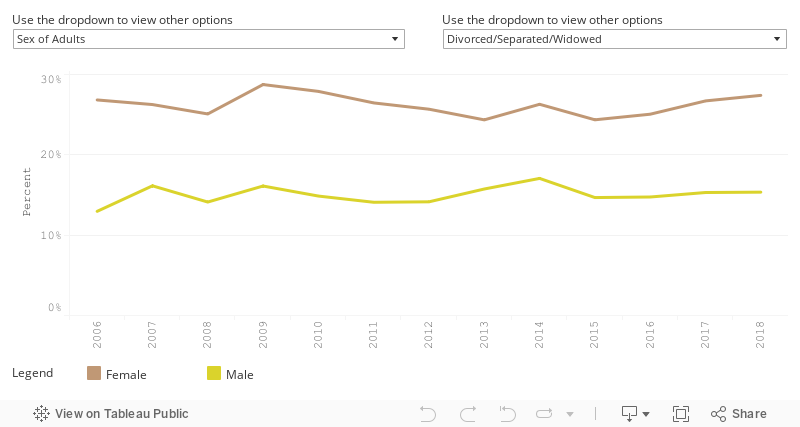
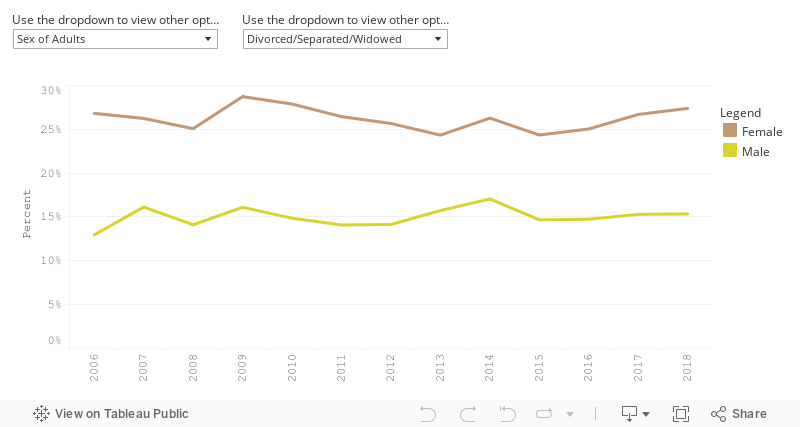
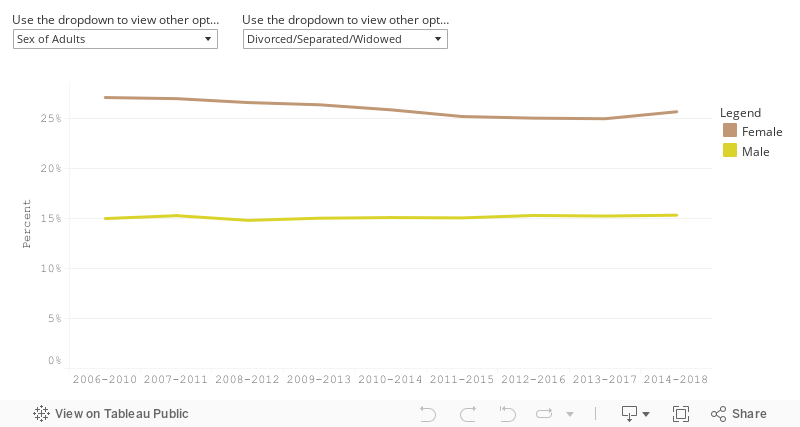
- Compared to males, females have higher rates of being divorced, separated, or widowed (27% of females in 2018) and lower rates of being either married or never married, at 42% and 30%, respectively.
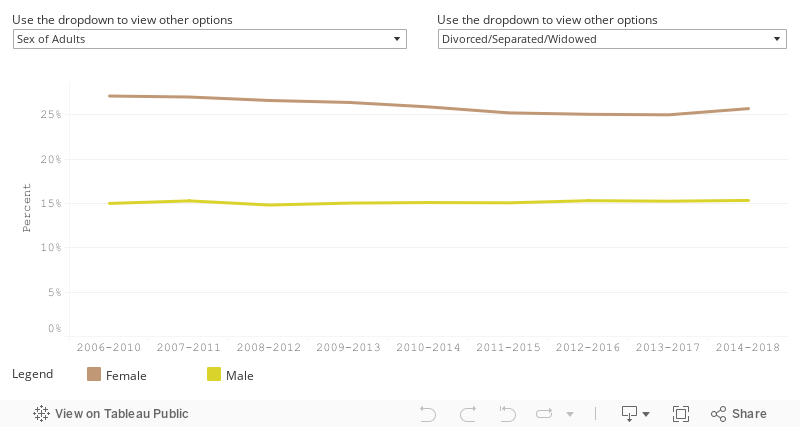
- On average, from 2014-2018, Black females have a significantly lower rate of being married (25%) compared to White females (53%) and Latina females (51%). Black and Latina females have higher rates of never marrying (Black and Latina at 47% and 33%, respectively) compared to White females (20%).
- Latina females have the lowest rate of being divorced, separated, or widowed at 16% compared to 27% for White and 28% for Black females.
- Among all females, there was a slight decrease in marriage rates and a slight increase in females having never married from 2006-2018; the rate of all females being divorced, separated, or widowed did not change significantly over that time.
Data Notes:
- Compared to males, females have higher rates of being divorced, separated, or widowed (27% of females in 2018) and lower rates of being either married or never married, at 42% and 30%, respectively.
- On average, from 2014-2018, Black females have a significantly lower rate of being married (25%) compared to White females (53%) and Latina females (51%). Black and Latina females have higher rates of never marrying (Black and Latina at 47% and 33%, respectively) compared to White females (20%).
- Latina females have the lowest rate of being divorced, separated, or widowed at 16% compared to 27% for White and 28% for Black females.
- Among all females, there was a slight decrease in marriage rates and a slight increase in females having never married from 2006-2018; the rate of all females being divorced, separated, or widowed did not change significantly over that time.
Household Types
1-year Estimates
5-year Estimates
Key Points:
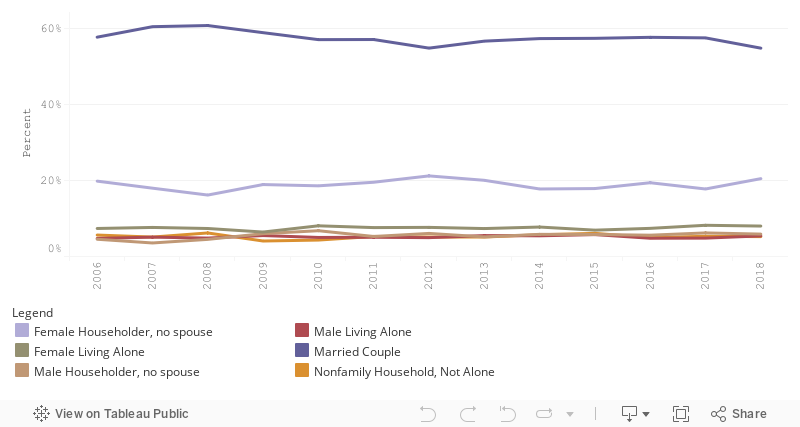
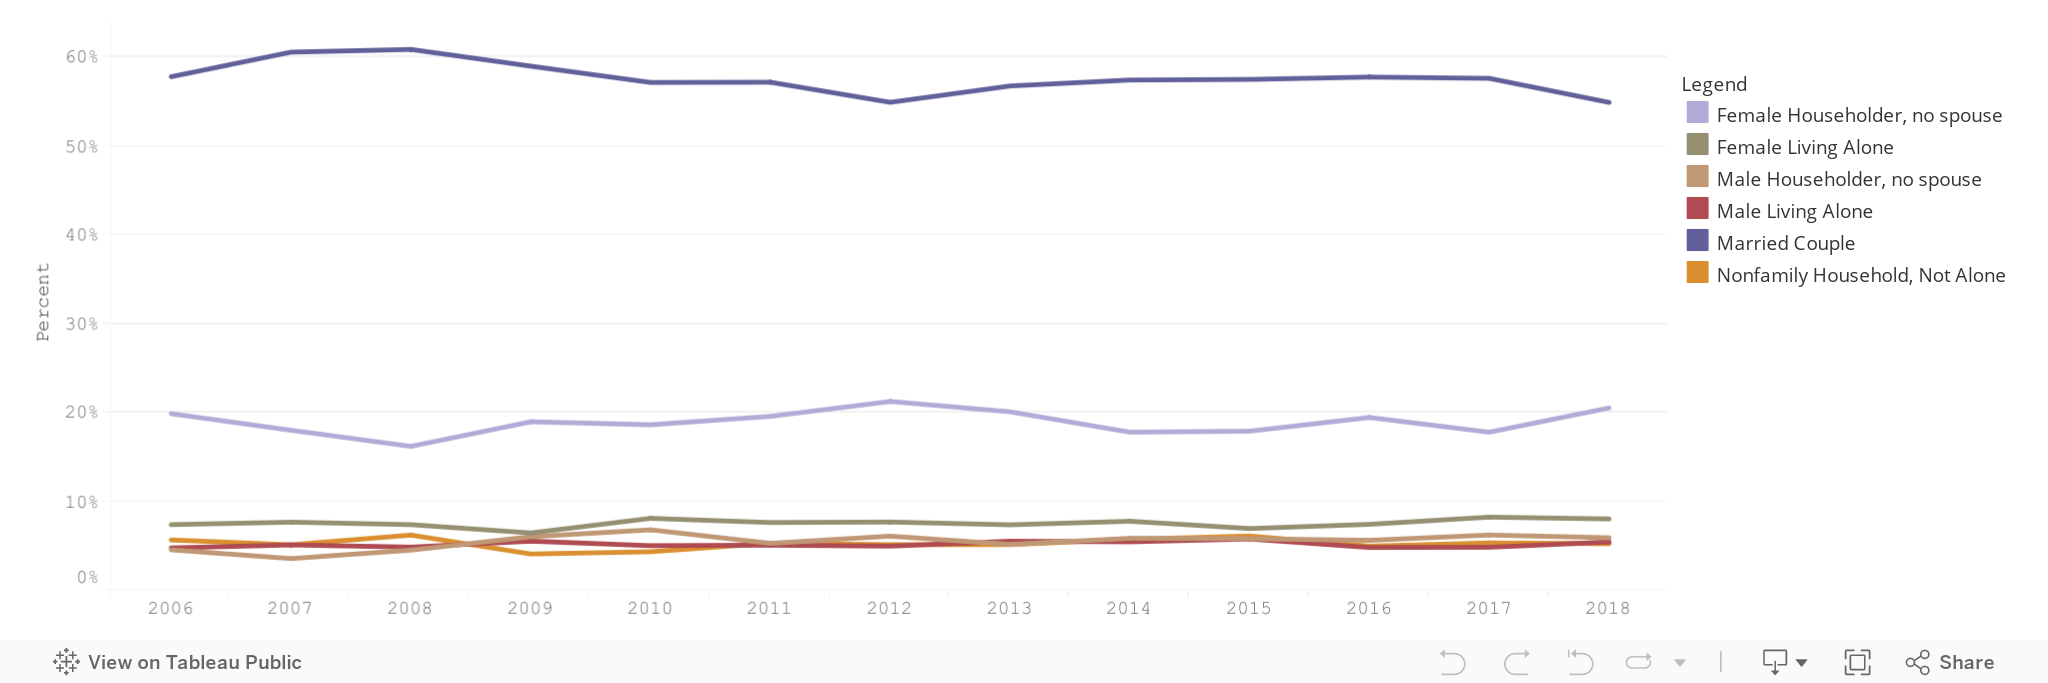
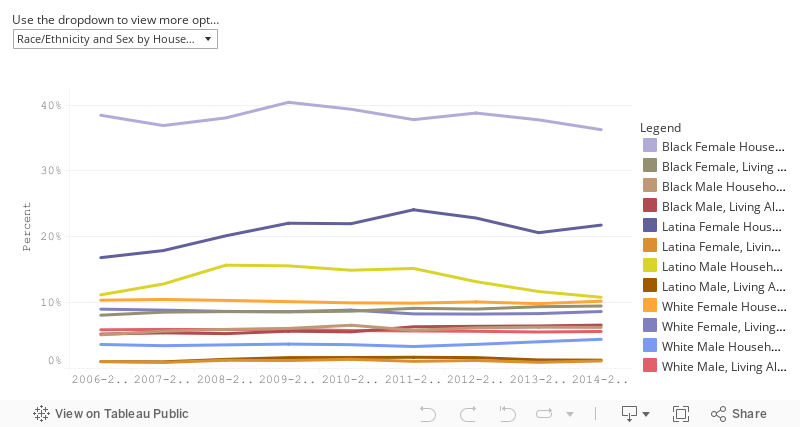
- In 2018, married households are the most common type of household with about 55% of residents reporting living in married-couple households. This is followed by female householders with “no spouse present” at 21%. All other household types were below 10%.
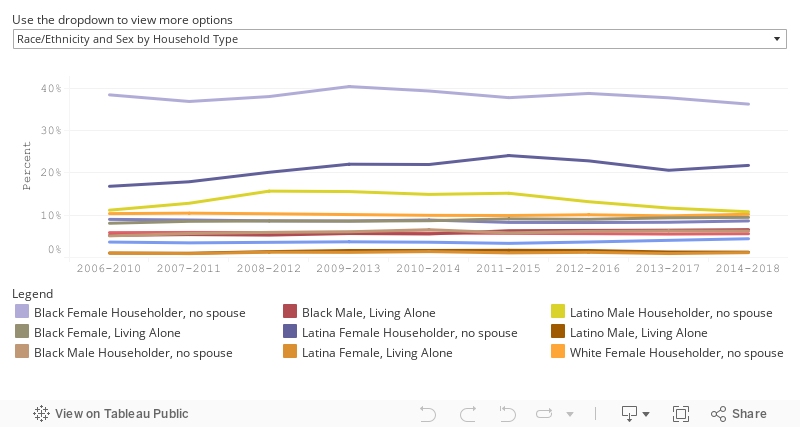
- Compared to Latinx and White residents, a lower proportion of Black residents lived in married-couple households from 2006-2018. From 2014-2018, an estimated 37% of Black residents lived in married-couple households compared to 64% of White residents, and 63% of Latinx residents.
- Additionally, from 2014-2018 a higher percentage of Black residents lived in female-headed households with no spouse present (36%) compared to White and Latinx residents (10% and 22% respectively).
Data Notes:
- In 2018, married households are the most common type of household with about 55% of residents reporting living in married-couple households. This is followed by female householders with “no spouse present” at 21%. All other household types were below 10%.
- Compared to Latinx and White residents, a lower proportion of Black residents lived in married-couple households from 2006-2018. From 2014-2018, an estimated 37% of Black residents lived in married-couple households compared to 64% of White residents, and 63% of Latinx residents.
- Additionally, from 2014-2018 a higher percentage of Black residents lived in female-headed households with no spouse present (36%) compared to White and Latinx residents (10% and 22% respectively).